Understanding how to analyze the survey data is just as important as the survey itself!
Taking the time to learn and understand survey analysis is essential. Survey analysis should be able to address the initial problem/ concern that you have had before you created a survey and it should be able to help you make decisions to better your business.
The best wording for your survey questions
In order to do address your issues properly, you need to start with the best wording for your
survey questions. It is important to form your questions in a way that will be able to provide you with meaningful insights. Therefore, you should try to avoid questions that have obvious answers, that are vague, confusing, include unknown terminology, or questions that are influenced by your perception/point of view.
Collecting an adequate number of responses
It is also essential to make sure that you have received enough survey responses. The more survey participants you have had, the better it is. There is no specific number that will guarantee 100% correct results, but more respondents will definitely reduce the survey results error. However, if for some reason you have access to a smaller sample of people that have agreed to provide you with their opinions (let’s say the 10 employees you have) you need to make sure that their answers are trustworthy enough to base your conclusions on them.
Staying focused
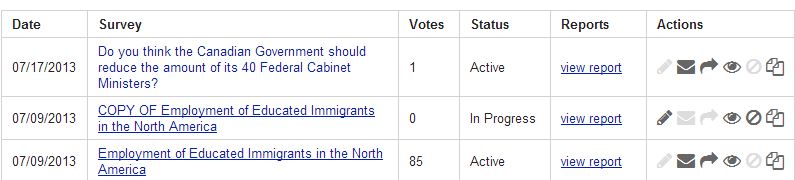
Once you have collected the survey data, try to stay on track and focus on the data that will provide you with the insights necessary to make decisions. Generate a report using Tellwut’s “Generate Report” feature that allows you to download an Excel file. There are two types of data you can look at: quantitative and qualitative.
Analyzing quantitative data
When analyzing quantitative data, you may want to send the same survey at multiple times to compare the answers over a larger period. You may also want to use benchmarking to calculate your average results to find out where you stand compared to other organizations in the industry. You can also compare the results of general questions with specific questions to better understand the sources of these results (Example:
What is your overall satisfaction? and look at
How satisfied are you with the product, customer service, shipping, etc.? to receive deeper insights). When analyzing survey results, it is important to also learn how to calculate rating average.
Calculating Rating Average:
Rating average can be computed for: numerical textbox answers, rating scale answers, and ranking answers.
Numerical Text box:
To calculate the average, take the sum all the answers and divide by the total number of answers.
Example: Let say the boxes in the image above were filled with the answers: 12, 13, 15 and there are 3 answers allowed.
12+13+15= 40
40/3=13.3 – is the rating average.
This average value, you can now compare to the industry benchmark.
Rating Scale Answers/ Metrix Design Answers
As we discussed in a previous
blog post, the rating scale is an easy way to measure the importance of each answer and allows you to add a weighted value to each answer.
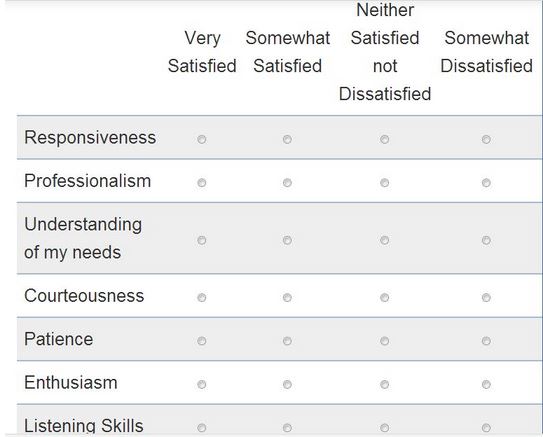
If you are asking your respondents to provide a rating value to your answers, in this case from 1 to 4- 1 being very satisfied and 4- being somewhat dissatisfied, you can calculate the average by multiplying the number of responses with the weighted values and summing them up. After that you divide that number by the total number of responses.
Example for weighted value:
1- Very satisfied (20 responses) – 1 weighted value
2- Somewhat satisfied (50 responses) - 2 weighted value
3- Nether satisfied, nor dissatisfied (40 responses) - 3 weighted value
4- Somewhat dissatisfied (30 responses) - 4 weighted value
Total number of responses: 20+50+40+30= 140
[(20x1) + (50x2) + (40x3) + (30x4)] /140=2.57 which is our rating average.
Once you have your rating average you can place it on your scale from 1 being very satisfied and 4 being somewhat dissatisfied and see that the respondents are somewhere in between somewhat satisfied (2) and neither satisfied nor dissatisfied (3).
Ranking answers:
Rating average can be applied to ranking survey answers as well. Every one of the answers provided below has a weighted value.
Rating weighted values for the Importance of “Exit Link”:
Example:
1- Very important (30 responses) – 1 weighted value
2- Important (45 responses)- 2 weighted value
3- Somewhat important (35 responses) – 3 weighted value
4- Less important (20 responses) – 4 weighted value
To calculate for the rating value for “Exit Link”:
Total number of responses for “Exit Link”: 30+45+35+20=130
Rating Average for “Exit Link”: (30x1) + (45x2) + (35x3) + (20x4)/ 130=305/130=2.3
2.3 is the rating average, placed on your scale from 1 to 4, 1- being very important and 4- being less important, is somewhere in between important and somewhat important.
Note: When N/A is present as an answer, it should have 0 weighted value and it should be excluded from your calculations.
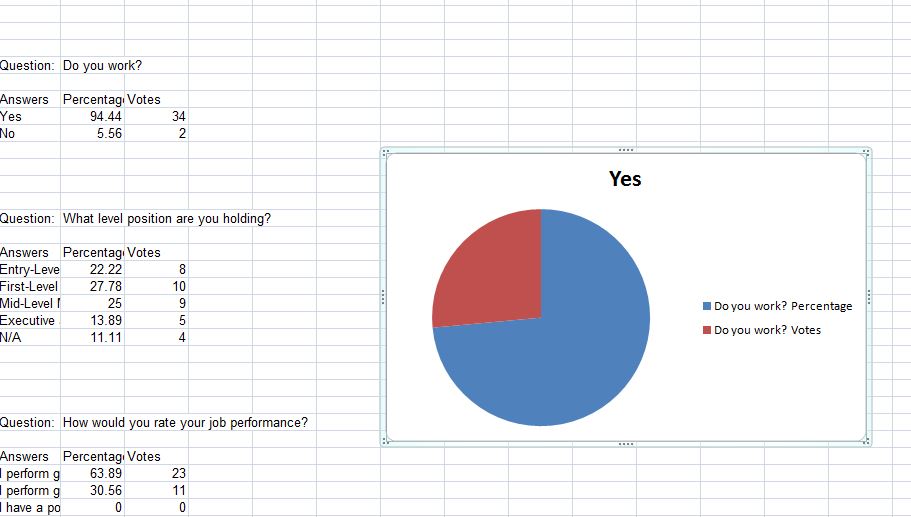
After you have exported your results data into an excel file, you can make it more visual and easier to analyze, by creating a chart in Excel. To do that you can follow these steps: select a question and its available answers, go under “Insert” and add a “Pie Chart” to look like on the image below or customize using any other chart option Excel offers.
 Analyzing qualitative data
Analyzing qualitative data can be a little bit more time consuming, but it will really help you gain deeper insights. Qualitative data can be collected when using an open box type of survey question or through the comment option provided by Tellwut after the available answers. You will be able to see the individual responses of the qualitative when you go under “View Report”
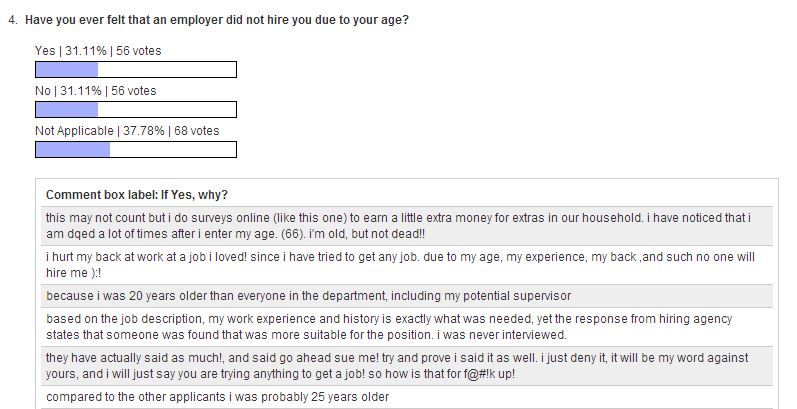
The qualitative data will be listed just as in the picture below.
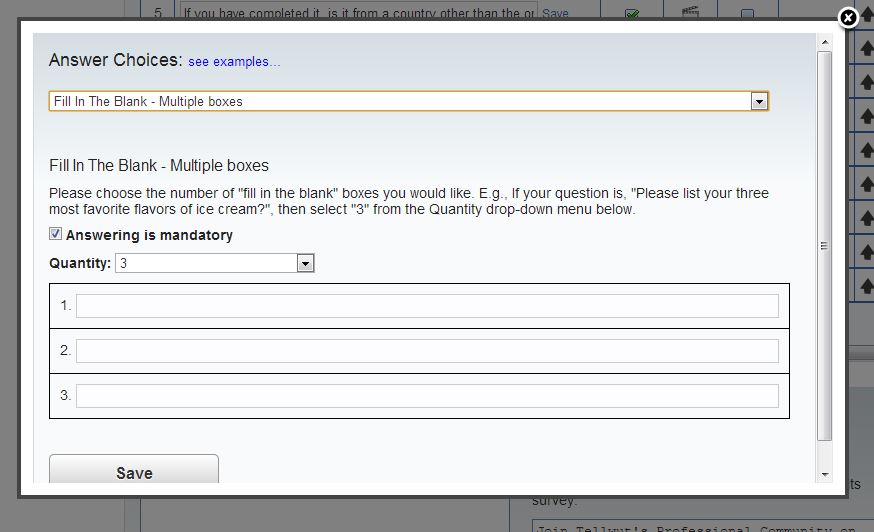
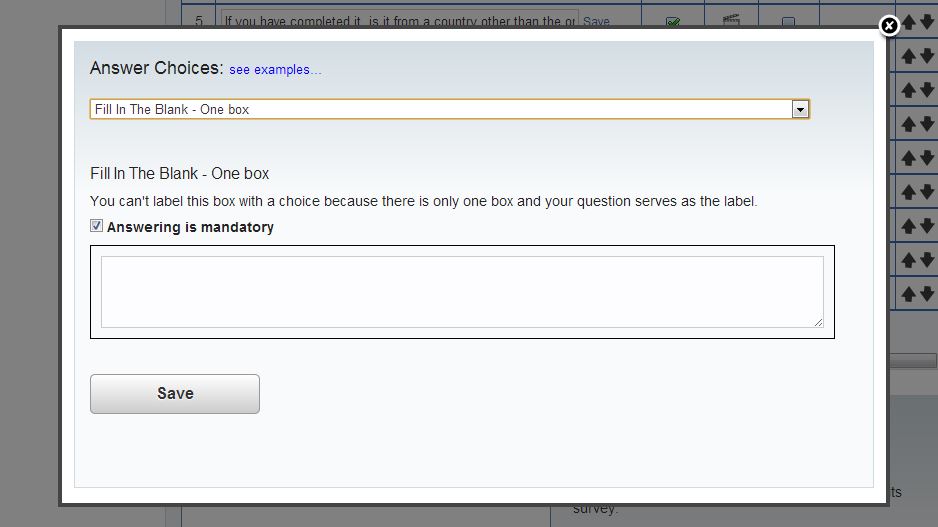
When using Tellwut’s survey software, you can select “fill in the blank- open box” or “fill-in the blank- multiple boxes” type of response like in the print shots below.
and
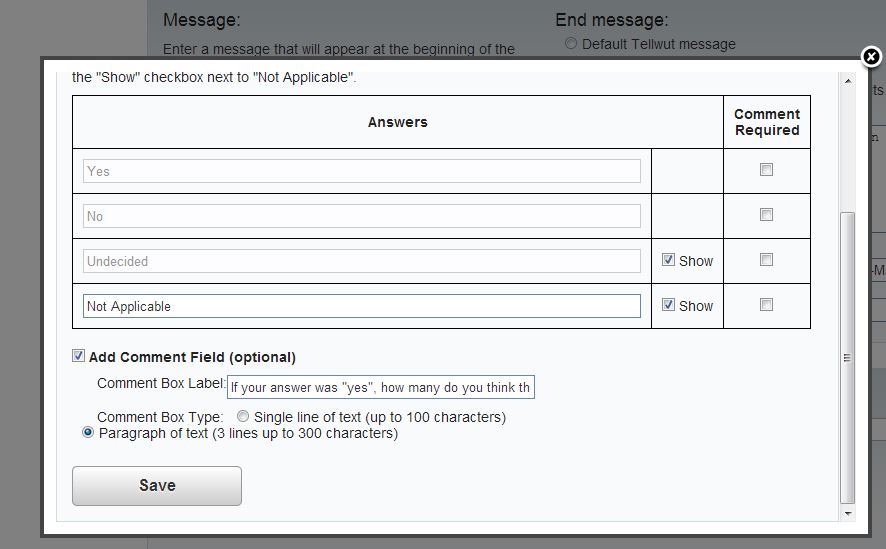
Or you can ask the respondents for an explanation for their responses to the quantitative survey questions. As shown in the images below, that can be in the form of a single line of text (up to 100 characters)
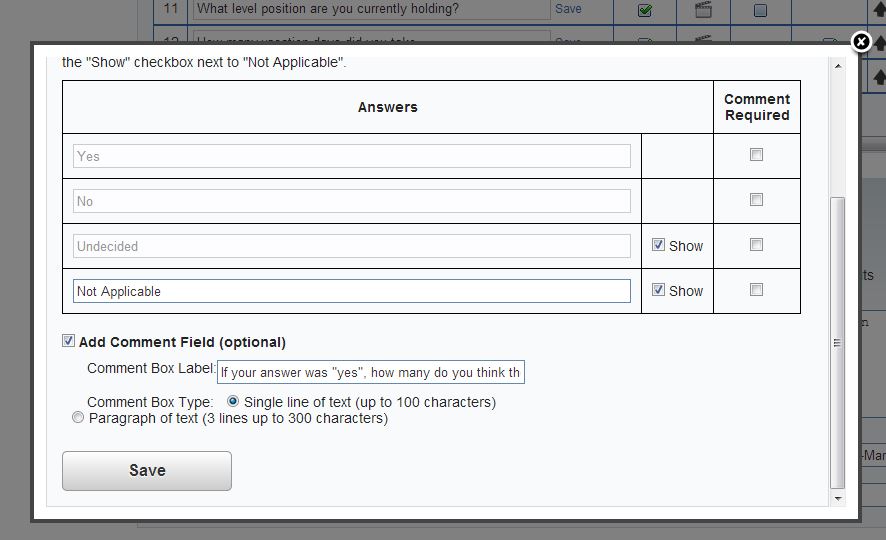
or a paragraph (up to 300 characters).
These types of responses will help you get a sense of what people think and can be a great solution if you don’t know what answers to provide for the participants. Although qualitative data takes time to analyze, it can be very beneficial to providing insights you may not have thought of.
Analyzing survey/ crowdsourced data and demographic data:
Something else to consider when analyzing survey results is the survey participants. There are a few ways to utilize surveys, you can send them directly to your stakeholders through private survey links, crowdsource the Tellwut voter base or target a specific demographic though
market research.
- When you send out surveys to your stakeholders (employees, vendors, customers, etc.) you will collect information only from the people that matter to you or your business.
- When you use survey crowdsourcing, you will send out a survey to a broad and general voter base. If you find the results interesting and would like to access more detailed demographic data, you can
contact us and take advantage of our demographic reports. You will then be able to see the your data segmented by different demographics (gender, location, age, income, etc.).
- If you would like to conduct market research, your survey will be sent to a targeted sample of people (Example: women, between the age of 18 and 30, in the US, who have children). You can then analyze the survey data collected from that specific group of people. For more information on market research and pricing please contact Elena Trifonova at etrifonova@tellwut.com.
Results from one type of analysis may lead to new questions, additional surveys and another round of data analysis and that is normal. Whatever choices you make for your research, you need to keep in mind that data analysis is a continuous process that can be very beneficial to your business. Get started
today.
To join our business e-newsletter list and get new business ideas, special discounts, consumer insights, and much more, click
here.
Happy surveying!
 To calculate the average, take the sum all the answers and divide by the total number of answers.
Example: Let say the boxes in the image above were filled with the answers: 12, 13, 15 and there are 3 answers allowed.
12+13+15= 40
40/3=13.3 – is the rating average.
This average value, you can now compare to the industry benchmark.
Rating Scale Answers/ Metrix Design Answers
As we discussed in a previous blog post, the rating scale is an easy way to measure the importance of each answer and allows you to add a weighted value to each answer.
To calculate the average, take the sum all the answers and divide by the total number of answers.
Example: Let say the boxes in the image above were filled with the answers: 12, 13, 15 and there are 3 answers allowed.
12+13+15= 40
40/3=13.3 – is the rating average.
This average value, you can now compare to the industry benchmark.
Rating Scale Answers/ Metrix Design Answers
As we discussed in a previous blog post, the rating scale is an easy way to measure the importance of each answer and allows you to add a weighted value to each answer.
 If you are asking your respondents to provide a rating value to your answers, in this case from 1 to 4- 1 being very satisfied and 4- being somewhat dissatisfied, you can calculate the average by multiplying the number of responses with the weighted values and summing them up. After that you divide that number by the total number of responses.
Example for weighted value:
1- Very satisfied (20 responses) – 1 weighted value
2- Somewhat satisfied (50 responses) - 2 weighted value
3- Nether satisfied, nor dissatisfied (40 responses) - 3 weighted value
4- Somewhat dissatisfied (30 responses) - 4 weighted value
Total number of responses: 20+50+40+30= 140
[(20x1) + (50x2) + (40x3) + (30x4)] /140=2.57 which is our rating average.
Once you have your rating average you can place it on your scale from 1 being very satisfied and 4 being somewhat dissatisfied and see that the respondents are somewhere in between somewhat satisfied (2) and neither satisfied nor dissatisfied (3).
Ranking answers:
Rating average can be applied to ranking survey answers as well. Every one of the answers provided below has a weighted value.
If you are asking your respondents to provide a rating value to your answers, in this case from 1 to 4- 1 being very satisfied and 4- being somewhat dissatisfied, you can calculate the average by multiplying the number of responses with the weighted values and summing them up. After that you divide that number by the total number of responses.
Example for weighted value:
1- Very satisfied (20 responses) – 1 weighted value
2- Somewhat satisfied (50 responses) - 2 weighted value
3- Nether satisfied, nor dissatisfied (40 responses) - 3 weighted value
4- Somewhat dissatisfied (30 responses) - 4 weighted value
Total number of responses: 20+50+40+30= 140
[(20x1) + (50x2) + (40x3) + (30x4)] /140=2.57 which is our rating average.
Once you have your rating average you can place it on your scale from 1 being very satisfied and 4 being somewhat dissatisfied and see that the respondents are somewhere in between somewhat satisfied (2) and neither satisfied nor dissatisfied (3).
Ranking answers:
Rating average can be applied to ranking survey answers as well. Every one of the answers provided below has a weighted value.
 Rating weighted values for the Importance of “Exit Link”:
Example:
1- Very important (30 responses) – 1 weighted value
2- Important (45 responses)- 2 weighted value
3- Somewhat important (35 responses) – 3 weighted value
4- Less important (20 responses) – 4 weighted value
To calculate for the rating value for “Exit Link”:
Total number of responses for “Exit Link”: 30+45+35+20=130
Rating Average for “Exit Link”: (30x1) + (45x2) + (35x3) + (20x4)/ 130=305/130=2.3
2.3 is the rating average, placed on your scale from 1 to 4, 1- being very important and 4- being less important, is somewhere in between important and somewhat important.
Note: When N/A is present as an answer, it should have 0 weighted value and it should be excluded from your calculations.
After you have exported your results data into an excel file, you can make it more visual and easier to analyze, by creating a chart in Excel. To do that you can follow these steps: select a question and its available answers, go under “Insert” and add a “Pie Chart” to look like on the image below or customize using any other chart option Excel offers.
Rating weighted values for the Importance of “Exit Link”:
Example:
1- Very important (30 responses) – 1 weighted value
2- Important (45 responses)- 2 weighted value
3- Somewhat important (35 responses) – 3 weighted value
4- Less important (20 responses) – 4 weighted value
To calculate for the rating value for “Exit Link”:
Total number of responses for “Exit Link”: 30+45+35+20=130
Rating Average for “Exit Link”: (30x1) + (45x2) + (35x3) + (20x4)/ 130=305/130=2.3
2.3 is the rating average, placed on your scale from 1 to 4, 1- being very important and 4- being less important, is somewhere in between important and somewhat important.
Note: When N/A is present as an answer, it should have 0 weighted value and it should be excluded from your calculations.
After you have exported your results data into an excel file, you can make it more visual and easier to analyze, by creating a chart in Excel. To do that you can follow these steps: select a question and its available answers, go under “Insert” and add a “Pie Chart” to look like on the image below or customize using any other chart option Excel offers.
 Analyzing qualitative data
 can be a little bit more time consuming, but it will really help you gain deeper insights. Qualitative data can be collected when using an open box type of survey question or through the comment option provided by Tellwut after the available answers. You will be able to see the individual responses of the qualitative when you go under “View Report”
Analyzing qualitative data
Analyzing qualitative data can be a little bit more time consuming, but it will really help you gain deeper insights. Qualitative data can be collected when using an open box type of survey question or through the comment option provided by Tellwut after the available answers. You will be able to see the individual responses of the qualitative when you go under “View Report”
 The qualitative data will be listed just as in the picture below.
 When using Tellwut’s survey software, you can select “fill in the blank- open box” or “fill-in the blank- multiple boxes” type of response like in the print shots below.
 and
and
 or a paragraph (up to 300 characters).
 These types of responses will help you get a sense of what people think and can be a great solution if you don’t know what answers to provide for the participants. Although qualitative data takes time to analyze, it can be very beneficial to providing insights you may not have thought of.
Analyzing survey/ crowdsourced data and demographic data:
Something else to consider when analyzing survey results is the survey participants. There are a few ways to utilize surveys, you can send them directly to your stakeholders through private survey links, crowdsource the Tellwut voter base or target a specific demographic though market research.
- When you send out surveys to your stakeholders (employees, vendors, customers, etc.) you will collect information only from the people that matter to you or your business.
- When you use survey crowdsourcing, you will send out a survey to a broad and general voter base. If you find the results interesting and would like to access more detailed demographic data, you can contact us and take advantage of our demographic reports. You will then be able to see the your data segmented by different demographics (gender, location, age, income, etc.).
- If you would like to conduct market research, your survey will be sent to a targeted sample of people (Example: women, between the age of 18 and 30, in the US, who have children). You can then analyze the survey data collected from that specific group of people. For more information on market research and pricing please contact Elena Trifonova at etrifonova@tellwut.com.
Results from one type of analysis may lead to new questions, additional surveys and another round of data analysis and that is normal. Whatever choices you make for your research, you need to keep in mind that data analysis is a continuous process that can be very beneficial to your business. Get started today.
To join our business e-newsletter list and get new business ideas, special discounts, consumer insights, and much more, click here.
Happy surveying!
These types of responses will help you get a sense of what people think and can be a great solution if you don’t know what answers to provide for the participants. Although qualitative data takes time to analyze, it can be very beneficial to providing insights you may not have thought of.
Analyzing survey/ crowdsourced data and demographic data:
Something else to consider when analyzing survey results is the survey participants. There are a few ways to utilize surveys, you can send them directly to your stakeholders through private survey links, crowdsource the Tellwut voter base or target a specific demographic though market research.
- When you send out surveys to your stakeholders (employees, vendors, customers, etc.) you will collect information only from the people that matter to you or your business.
- When you use survey crowdsourcing, you will send out a survey to a broad and general voter base. If you find the results interesting and would like to access more detailed demographic data, you can contact us and take advantage of our demographic reports. You will then be able to see the your data segmented by different demographics (gender, location, age, income, etc.).
- If you would like to conduct market research, your survey will be sent to a targeted sample of people (Example: women, between the age of 18 and 30, in the US, who have children). You can then analyze the survey data collected from that specific group of people. For more information on market research and pricing please contact Elena Trifonova at etrifonova@tellwut.com.
Results from one type of analysis may lead to new questions, additional surveys and another round of data analysis and that is normal. Whatever choices you make for your research, you need to keep in mind that data analysis is a continuous process that can be very beneficial to your business. Get started today.
To join our business e-newsletter list and get new business ideas, special discounts, consumer insights, and much more, click here.
Happy surveying!
Comments